In 2021, with the gradual recovery of the global economy, the container shipping market will develop rapidly. In 2020, the total volume of global seaborne container trade reached 1.959 billion tons, accounting for about 17% of the total global seaborne trade market, an increase of 1 percentage point over 2020.
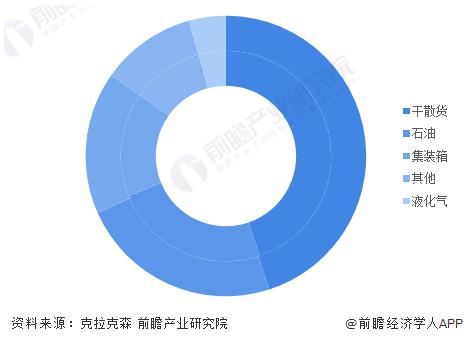
Chart 1
2020-2021 Proportion of trade volume by cargo type in the national shipping market (by cargo weight) (unit: %)
In terms of the growth rate of trade volume, in 2021, container transportation will be the fastest-growing segment of the entire shipping market, with an increase of 5.8%, which is 2.2 percentage points higher than the overall growth rate of the shipping market.
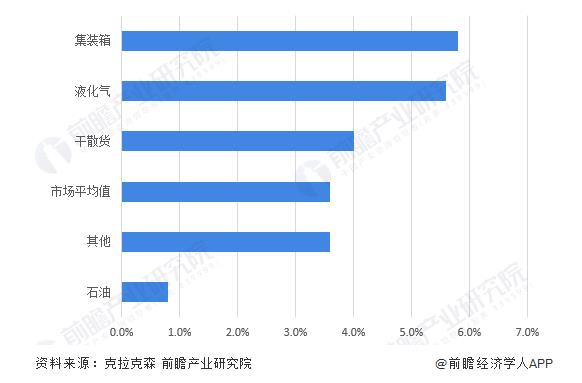
Chart 2
Year-on-year growth in the trade volume of different types of goods in the global shipping market in 2021 (unit: %)
Global container ship capacity to grow further in 2021
To meet rapidly growing trade demands, the capacity of the global container fleet has grown further. By the end of 2021, the total capacity of global container ships exceeds 280 million deadweight tons and 24 million TEUs. In terms of load capacity, it will increase by 2.5% year-on-year in 2021; in terms of the number of TEUs, it will increase by 4.5% year-on-year.
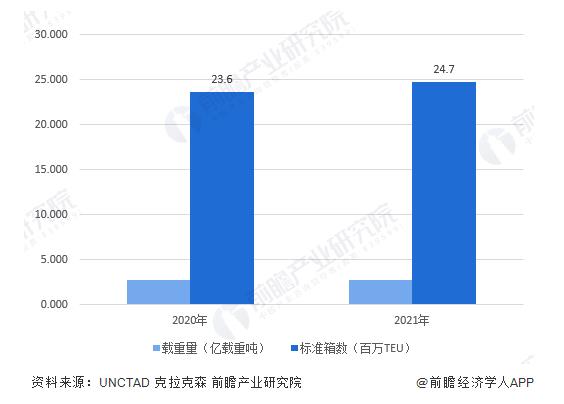
Chart 3
2022-2021 Global container ship total capacity (unit: 100 million DWT, 1 million TEU)
Soaring global container shipping rates cause consumer prices to rise
The shortage of supply in the global container shipping market has also led to a rapid and continuous increase in container freight rates. Referring to the changing trend of China Maritime Silk Road Container Import and Export Freight Index released by Shanghai Shipping Exchange, since the second half of 2020, container import and export freight rates have continued to rise, and as of early 2022, the upward momentum is still continuing. The main reason is that the global container transportation capacity is constrained by logistical obstacles and shortage of container capacity. In addition, factors such as unreliable shipping schedules and port congestion have also led to various surcharges soaring.
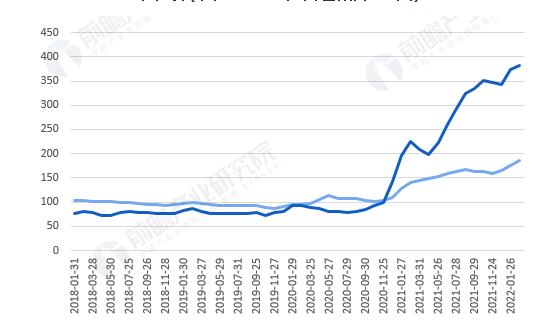
Chart 4
2018-2022 China Maritime Silk Road Import and Export Container Freight Index Change Trend (unit: January 2015 base period is 100 points)
According to data from the United Nations Conference on Trade and Development (UNCTAD), based on the recent increase in global container freight rates, it is expected that the global import price level will increase by an average of 11% by 2023, and the overall price in the global consumer market will also be higher than without the freight rate surge. 1.5% higher; and the impact will be more severe for smaller economies that rely heavily on imported goods for their consumption needs, with import prices expected to rise by around 24% in SIDS by 2023, Consumer prices will rise 7.5%.
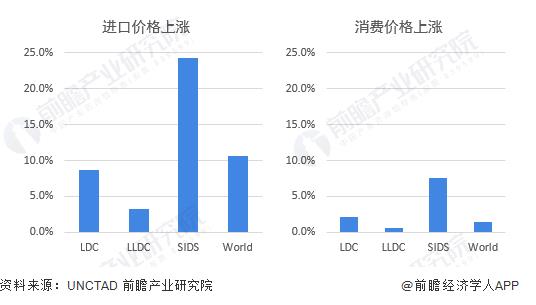
Chart 5
Analysis of the impact of the increase in global container freight rates in 2020-2021 on global import and consumer prices in 2023 (unit: %)
Notes: 1) LDC – Least Developed Countries, LLDC – Landlocked Developing Countries, SIDS – Small Island Developing States, World – World Average; 2) The impact of soaring container freight rates on prices is based on August 2020 By August 2021, the China Container Freight Composite Index has risen by 243%. The simulation model assumes that freight rates in August 2021 will remain constant for the remainder of the simulation period (September 2021 to December 2023) and all other factors remain constant throughout the simulation period (August 2020 to December 2023) constant.
The above data comes from the Prospective Industry Research Institute